Sunday, February 26, 2012
The 25 Most Modern Libraries in the World
http://www.bestcollegesonline.com/blog/2008/07/02/the-25-most-modern-libraries-in-the-world/
Saturday, February 4, 2012
Situationist map

Thursday, February 2, 2012
This map interested me for its contrast in the clarity to others of the same type. There have been many maps of the internet and they generally appear like some cellular/fractal/fungal constellation. These maps are almost always beautiful but never particularly informative. This map of the internet breaks down the information into very clear, concise statements. 
I was inspired by this map for its beauty and informative quality. This map is of the flood regions along a particular stretch of Mississippi River. The point is not that you inderstand which regions flood first or how long it will take. What is important in the image is that the flooding patterns are complicated, are much greater in area than that of the river, and have edges which shift on a yearly basis.


Mapping - Digital Architecture? - Work in Progress
The project below struck me when I first saw it in one of my previous studios. The initial mapping diagram was so simple and clean, and resembles what many of us have produced in past site analyses. The following iterations became more complex and developed through unrelated, though structured, manifestations of the same diagram.
I posted the whole page, but here is the link too (maybe):
Architectural Diagrams - Work In Progress
‘Architectural Diagrams: Temporal Shifts in the Urban Context’
Project by Jarrod Lamshed, UTS Design, Architecture and Building.
“The project manifests itself in the form of a new ‘fish market’ and ‘urban park’ on the edge of the city.” (Lamshed 2005)
1. Diagram: Movement (& Circulation)
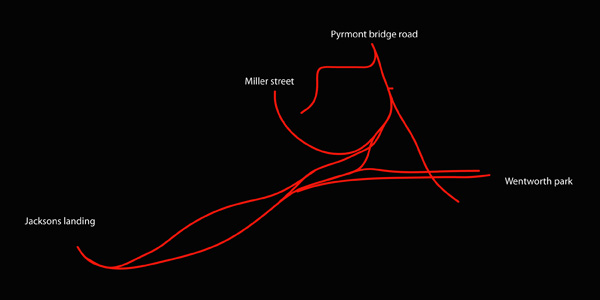
The traditional design process could be described as a ‘black-box’: the journey toward a ‘solution’ via consideration of a complex set of information based ‘problems’. In this process, the role of intuition is often emphasised to cover the vagaries of a frequently nebulous negotiation of client requirements (or program), planning and building controls, historical precedent and urban context. However, in our case study of Digital Architecture, Lamshed presents a tightly bound hypothesis: “What is the role of the Architectural ‘Diagram’ within the urban context?” (Lamshed 2005) Here, it seems that from many possible beginnings, a key aspect of the architectural experience has been isolated and intensified in order to ‘generate’ an architectural response. Given our dilemma of the temporal in Digital Architecture, the focus here has been to identify existing and latent patterns of movement (or circulation) operating within the Sydney Fish Market site and edges. This design process, which treats the architectural site as a dynamic ‘system’, asserts itself in opposition to the heroism of the Modernist architects, who sought to superimpose their grand visions upon a Tabula rasa. Lamshed justifies his approach as “an attempt to reassess and reconfigure the relationship between program and circulation in the making of architecture on an urban scale.” (Lamshed 2005)
2. Diagram: ‘Array’
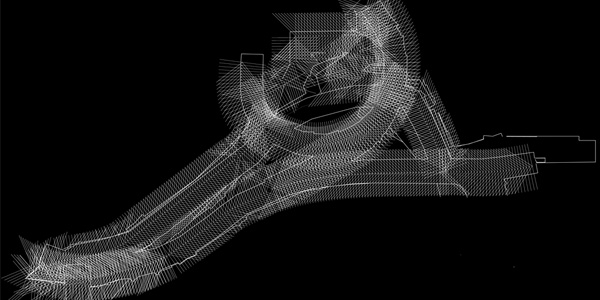
While the red computer rendered ‘sketch’ in Step 1 might still be equated to an architect’s ink sketch on the back of the restaurant napkin after the client dinner, what happens next is markedly different…
The next stage of the Digital Architecture process involves a two dimensional ‘array’ of ‘structure’ along the movement Diagram. The Diagram now incorporates parametric information which can be manipulated toward the determination of three dimensional form. Here, one needs to negotiate the new architectonic language (derived from mathematics) of ‘splines, nurbs, fields and folds’ which presents a challenge to its Cartesian equivalents of ‘points, lines, planes and volumes’. Also of significance, is that the role of the Digital Architect, is not superseded by computer software, but rather redefined as a processor/manipulator of information. For example, the array operation involves the selection of an (abstract) 5m x 40m structural grid extruded along the movement Diagram. This seems enacted from both an intuitive and pragmatic understanding of the extent of territory and floor space required by the program, within the given limitations of the site and existing urban infrastructure. Lamshed’s experimental design strategy, based upon the Architectural Diagram, is informed by Professor Andrew Benjamin. (Benjamin 2000)
3. Diagram: ‘Mapping & Transformation’
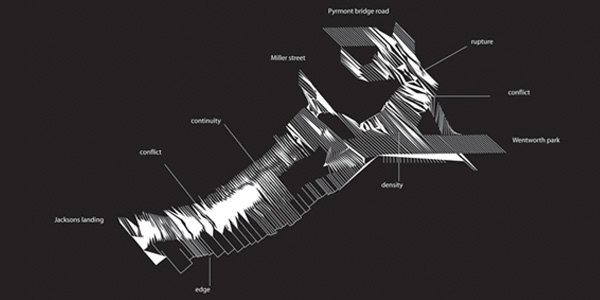
Next, the Diagram enters a realm of further digital manipulation through software operations described in terms of “density, rupture, continuity and conflict.” (Lamshed 2005) Here, the task is to project multiple extents and edges from the Diagram to define a series of boundaries. The various elements of the program (or brief) include: a retail arcade, a night soccer venue, an auction house and park/landscape areas with sheltered pedestrian access. At this stage, distinct spatial requirements are correlated with the evolving Diagram via processes of mapping and transformation.
4. Diagram: ‘Deformation’
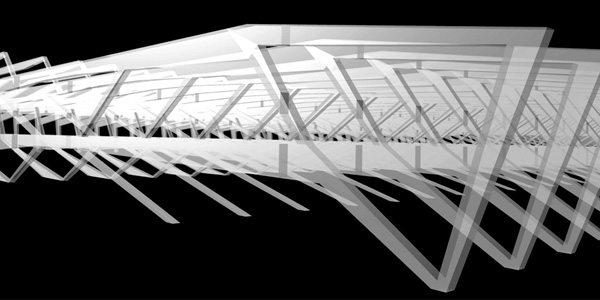
It is only now that we can witness an ‘emerging’ form of the architecture. This is informed by a series of (parametric) ‘index’ points which retain the temporal complexities of the initial Diagram. The goal here is to design a structure/enclosure which maintains the temporal, plastic and dynamic qualities embedded in the initial ‘movement’ Diagram - whilst obeying the various structural, environmental, planning and amenity requirements expected for any building. And it is here we could say that the diagram ‘stops’ – toward becoming shelter and enclosure.
It needs to be mentioned that the four stages highlighted above are a simplification of Lamshed’s spatially dexterous moves, for the sake of clarity to a wider audience.
Proposed Fish Market & Urban Park
Images by Jarrod Lamshed
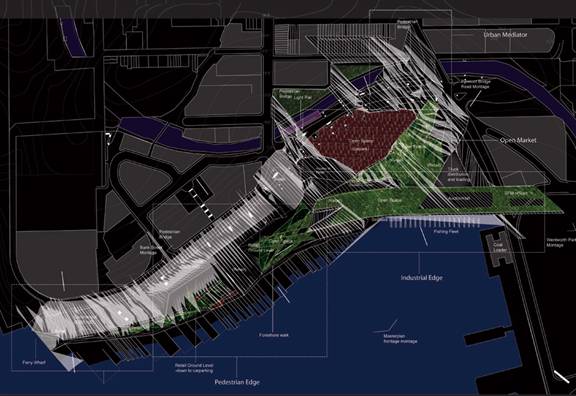
A key feature of Digital Architecture is its inability to be represented by the language of traditional architectural drawings: plans, sections and elevations. In their place, 3D photomontage/visualisations and real-time ‘walkthroughs’ allow a viewer better access. I have included an overall site plan (above) in order to place the following sequence of images in context, but firmly believe that the rendered images best emulate the fluidity of the scheme.
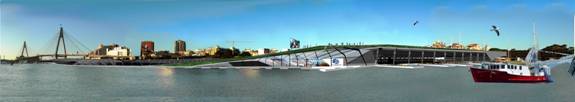
Photomontage of Sydney Fish Markets in harbour context, Anzac Bridge beyond.
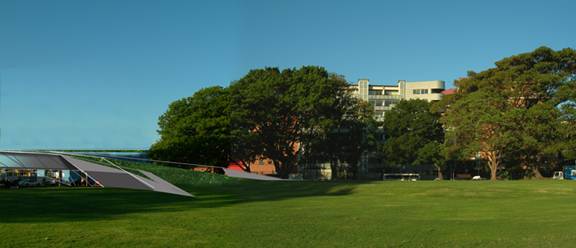
The building and the terrain seamlessly integrate to form the Urban Park.
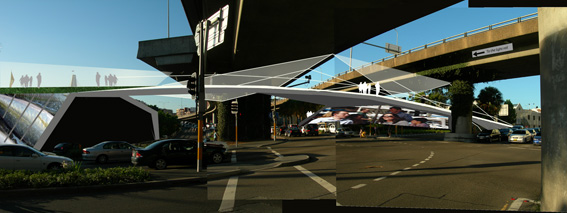
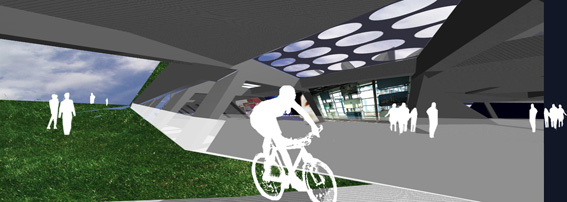
The bridge under the existing freeway allows increased pedestrian access to the Sydney Fish Markets.
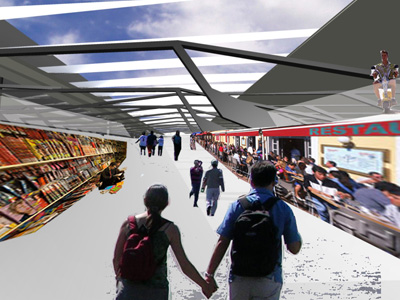
The Urban Park stimulates a diversity of activity in, around, above and below the enclosure.
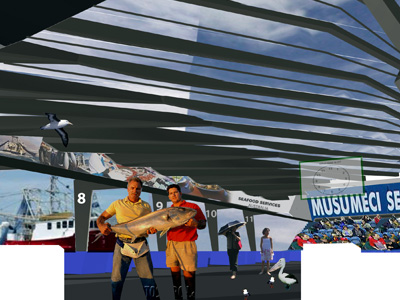
The ‘Auction House’ within the Fish Markets showing fenestration and amenity.
A ramp between commercial and leisure spaces with skylight over.
These photomontages give a strong impression of the potential for Digital Architecture. A few things come to mind. For one, the various ramps and pedestrian devices seem to dismiss altogether the conventional notion that the floor of a building needs to be flat and instead contribute to the spatial fluidity of the enclosure. In fact, this ‘building’ seems more analogous to a terrain, landscape architecture or land art. It is not surprising that similar metaphors, based upon geological strata (of forests, canyons, dunes and glaciers) have been recently adopted. (Schumacher 2004: 28) Also, the ‘building’ appears to function as a homogenous entity: the fenestration is defined within the interstitial spaces of structure, the roof folds downward to form the walls, which intersect with the ground plane. Overall there exists an equivalence of architectonic elements in both their form and materiality. In summary, this building performs as an interactive ‘system’ or ‘network’: which distributes a complex series of spaces and events, including bridges, motorways, parks, markets, industrial, sporting, commercial and retail spaces. In addition, the images presented reveal the building as a ‘container’ for the (ever-increasing) production/ and consumption of interactive digital media content incorporated into various surfaces.
All this complexity ‘generated’ from the Architectural Diagram. What is clear, from Lamshed’s project, is that along with the seamless connectivity currently being enabled between digital technologies and the material world (evident in our latest digital gadgets and appliances), notions of networks, software, connectivity and interfaces will become increasingly relevant descriptions of our buildings and cities in the (near) future.
References Benjamin, A. (2004) “The Standards of the Non Standard” in Architectural Review Australia 087: p34.
Benjamin, A. (2000) “Lines of Work: On diagrams and drawing” in Architectural Philosophy: Repetition, Function, Alterity pp 143-55
Koolhaas, R. (2004) “Box vs. Blob” in Content pp70-71
Lamshed, J. (2005) Architectural Diagrams: Temporal Shifts in the Urban Context, UTS Dissertation
Schumacher, P. (2004) Digital Hadid: Landscapes in Motion, Basel: Birkhäuser
Links
www.emergentforms.blogspot.com
www.noxarch.com
www.zaha-hadid.com
Alex Munt is an Associate Lecturer in media in the Media Department, at Macquarie University. His research focus is on Digital Cinema. He also teaches architecture and design at the University of New South Wales.
Wednesday, February 1, 2012
Mapping Precedents - BIG


You can find these images on BIG (Bjark Ingels Group) at http://www.big.dk/
The project these images represent is a mater plan for the Copenhagen suburbs.
I chose these images for their simplicity, aggressiveness, and quality of statement or maybe just "clarity" is a better word, at least a more objective one.


Subscribe to:
Posts (Atom)